
Data Mining is a computational process of discovering patterns and knowledge from large amounts of data. It involves methods from statistics and artificial intelligence with database management to analyze large datasets and extract valuable information. During tech interviews, data mining questions test a candidate’s proficiency in analyzing data, establishing patterns, and utilizing this information to make strategic decisions. A good understanding of data mining points to an ability to make effective use of database technologies, statistical analysis, and machine learning algorithms.
Data Mining Fundamentals
- 1.
Define data mining and explain its importance in the modern data-driven world.
Answer:Data mining is a step in the big data analytics process. It leverages computational techniques to extract patterns, trends, and actionable insights from vast datasets.
Key Techniques in Data Mining
- Clustering: Identifies natural groupings in data.
- Classification: Categorizes data based on previous observations.
- Association: Uncovers relationships between variables.
- Regression: Maps relationships to predict numerical values.
- Anomaly Detection: Flags unusual data points.
- Summarization: Generates compressed descriptions of extensive data.
Importance in Modern Businesses
- Personalization: Delivers tailored experiences, from targeted marketing to optimized product recommendations.
- Risk Assessment: Identifies potential issues and allows for proactive management.
- Customer Segmentation: Divides customers into groups with shared characteristics, improving marketing strategies.
- Process Optimization: Automates repetitive tasks and streamlines operations.
- Compliance & Fraud Detection: Helps in identifying fraudulent activities and ensures legal and ethical adherence.
- 2.
What is the difference between data mining and data analysis?
Answer:Data Mining (DM) and Data Analysis (DA) are both integral stages of the broader knowledge discovery process, or KDD. Each serves distinct yet complementary roles. Let’s look at their differences and relationship.
Distinct Objectives
-
Data Mining: Seeks to uncover patterns, correlations, and insights from large datasets, often using techniques like machine learning and statistical modeling.
-
Data Analysis: Focuses on understanding data characteristics, distribution, and relationships to answer specific business questions or build predictive models.
Mining Approaches
-
Data Mining: Tends to be more exploratory and hypothesis-generating. It often reveals unexpected patterns and associations, necessitating robust validation.
-
Data Analysis: Typically adopts a more targeted approach. It might begin with specific hypotheses and then use statistical tests to verify or refute these hypotheses.
Scale and Scope
-
Data Mining: Primarily caters to large, multi-dimensional datasets, spanning diverse areas like text, images, and transactions.
-
Data Analysis: Adapts to varying dataset sizes and focuses on more specific, domain-driven questions.
Techniques and Tools
-
Data Mining: Leverages advanced algorithms from fields like machine learning and pattern recognition. Tools might include clustering for segmenting data or association rule mining for finding co-occurring items.
-
Data Analysis: Utilizes statistical methods for understanding data. This includes techniques such as regression for modeling relationships and t-tests for comparing means.
Real-World Applications
-
Data Mining: Often deployed in settings like customer relationship management (CRM), market basket analysis, and fraud detection.
-
Data Analysis: Finds use in scenarios like A/B testing, customer profiling, and risk assessment.
-
- 3.
How does data mining relate to machine learning?
Answer:Data mining and machine learning are interwoven disciplines that both draw on statistical methods for data extraction and evaluation.
Data Mining: Unearthing Information
Data mining concentrates on uncovering previously unknown patterns in data through exploration and hypothesis testing. The goal is to extract useful information and make forecasts. Common data mining processes include:
- Clustering: Identifying inherent groupings in the data.
- Outlier Detection: Isolating data points that deviate significantly from the norm.
- Pattern Discovery: Recognizing common structures in the data.
Machine Learning: Predicting and Optimizing
Machine learning tasks often focus on prediction and optimization by learning from the data, which is actionable in real-time scenarios. Core tasks in machine learning include:
- Regression: Predicting continuous outcomes.
- Classification: Assigning discrete labels to data points.
- Reinforcement Learning: Training agents to act optimally within an environment.
Data mining might reveal that a certain demographic of customers show specific buying behavior, whereas machine learning can use these insights to:
- Cluster new customers that fit this demographic.
- Predict the likelihood of a group of customers making a purchase.
- Optimize customer experiences in real-time.
Both data mining and machine learning contribute to the data-driven decision-making process in distinct, yet complementary ways.
- 4.
Explain the concept of Knowledge Discovery in Databases (KDD).
Answer:Knowledge Discovery in Databases (KDD) is a multi-step iterative process used to derive high-level insights and patterns from raw data. The goal of KDD is to transform data into actionable knowledge.
KDD Process Steps
-
Data Selection: Choose the dataset that aligns with the specific problem.
-
Data Pre-processing: Clean, normalize, and transform the data to make it suitable for analysis.
-
Data Reduction: Use techniques like sampling or attribute selection to obtain a manageable dataset.
-
Data Transformation: Convert the data into a more appropriate form for mining. This may include methods like aggregation or discretization.
-
Data Mining: Utilize specialized algorithms to discern patterns and correlations within the data.
-
Pattern Evaluation: Investigate the discovered patterns to determine their validity and usefulness.
-
Knowledge Representation: Use different visualization tools to communicate the findings effectively.
-
Knowledge Refinement: Integrate additional sources of data and refine the discovered knowledge.
-
Use of Discovered Knowledge: Employ the insights, patterns, or models to make informed business decisions or predictions.
KDD vs. Other Data Processes
-
ETL (Extract, Transform, Load): While ETL focuses on data movement and preparation, KDD emphasizes discovering actionable insights.
-
CRISP-DM (Cross-Industry Standard Process for Data Mining): Both CRISP-DM and KDD are multiphase processes, but KDD is more concerned with data discovery for decision making rather than the broader scope of CRISP-DM.
KDD Challenges
-
Data Quality and Consistency: KDD relies on extracting insights from high-quality data, and ensuring accuracy can be challenging.
-
Computational Requirements: KDD processes can be computationally intensive, especially with large datasets and complex analysis techniques.
-
Privacy and Ethical Concerns: With the growing emphasis on data privacy, ensuring that KDD processes are conducted in an ethical and privacy-compliant manner is crucial.
-
Interpretability: The insights and patterns derived from KDD can sometimes be complex and difficult to interpret, making it challenging to explain them to stakeholders who lack technical expertise.
KDD: An Iterative Path to Knowledge
The KDD process is not strictly linear, but rather an iterative cycle, where each step influences the others. It’s an ongoing process of refining data-driven intelligence that can drive business decisions and innovations.
-
- 5.
What are the common tasks performed in data mining?
Answer:Data mining involves discovering patterns, relationships, and insights within large datasets.
Common Tasks
Clustering
- Definition: Identifies naturally occurring clusters in the data. Points within the same cluster share high similarity, while those in different clusters are dissimilar.
- Use-Cases: Market segmentation, document clustering for topic identification.
- Algorithms: K-means, DBSCAN, Hierarchical clustering.
Classification
- Definition: Predicts a category or class label for a data instance.
- Use-Cases: Email spam detection, medical diagnosis, sentiment analysis.
- Algorithms: Decision Trees, Naive Bayes, Random Forest.
Regression
- Definition: Predicts a continuous numerical value for a data instance.
- Use-Cases: Stock price prediction, demand forecasting, housing price analysis.
- Algorithms: Linear Regression, Support Vector Machines, Decision Trees.
Association Rule Learning
- Definition: Discovers associations between items in a dataset.
- Use-Cases: Market basket analysis, recommendation systems.
- Algorithms: Apriori, Eclat.
Dimensionality Reduction
- Definition: Reduces the number of input variables or features to make the analysis more efficient.
- Use-Cases: Visualizing high-dimensional data, feature selection for model training.
- Algorithms: PCA, t-SNE.
Outlier Detection
- Definition: Identifies data instances that deviate significantly from the rest of the dataset.
- Use-Cases: Fraud detection, sensor data monitoring.
- Algorithms: Isolation Forest, LOF.
Text Analysis
- Definition: Extracts useful information from textual data.
- Use-Cases: Sentiment analysis, document categorization.
- Algorithms: TF-IDF, Word Embeddings.
Time Series Analysis
- Definition: Analyzes sequences of data points ordered in time.
- Use-Cases: Stock market forecasting, weather prediction.
- Algorithms: ARIMA, Exponential Smoothing.
Visual Data Analysis
- Definition: Provides a visual interface for data exploration.
- Use-Cases: Exploratory data analysis, pattern recognition.
- Tools: Matplotlib, Seaborn, Plotly.
Data Preprocessing
- Definition: Cleans and prepares the data for analysis.
- Tasks: Missing data imputation, feature scaling, encoding categorical variables.
- Techniques: Z-score normalization, One-Hot Encoding.
Bespoke Methods
In addition to these traditional techniques, data mining may also involve custom models and algorithms tailored to unique datasets and goals.
Code Example: K-means Clustering
Here is the Python code:
from sklearn.cluster import KMeans import matplotlib.pyplot as plt import pandas as pd # Load data data = pd.read_csv('data.csv') X = data[['feature1', 'feature2']] # Initialize and fit KMeans model kmeans = KMeans(n_clusters=3, random_state=42) kmeans.fit(X) # Visualize plt.scatter(X['feature1'], X['feature2'], c=kmeans.labels_, cmap='viridis') plt.scatter(kmeans.cluster_centers_[:, 0], kmeans.cluster_centers_[:, 1], s=300, c='red') plt.show() - 6.
Describe the CRISP-DM process in data mining.
Answer:CRISP-DM (Cross-Industry Standard Process for Data Mining) is a comprehensive data mining method that provides structured stages for a successful data mining project. It’s designed to be iterative, flexible, and goal-oriented.
The process recognizes that data mining projects are often long-term and don’t typically follow a simple linear sequence. Therefore, it emphasizes learning from each iteration and revisiting previous steps when necessary.
Visual Representation
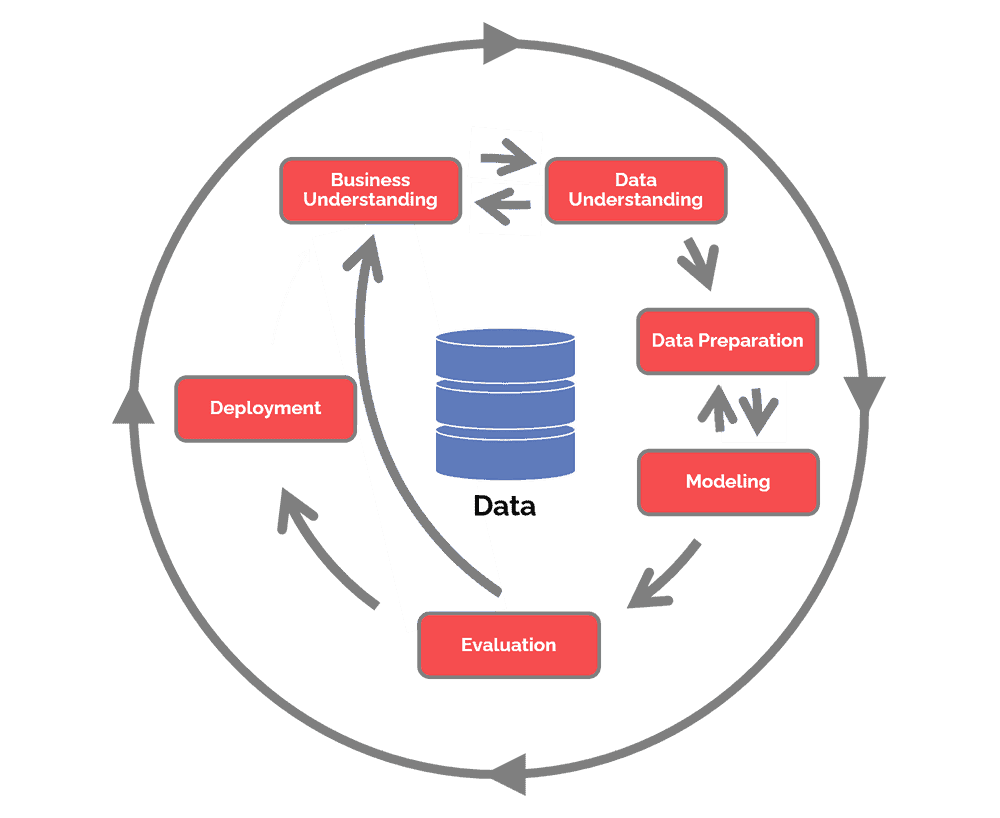
CRISP-DM Stages
-
Business Understanding: Identify the problem, business objectives, and success criteria. Define how data mining can help the business.
-
Data Understanding: Familiarize yourself with the available dataset. Discover initial insights and assess data quality.
-
Data Preparation: Select, clean, transform, and integrate data as needed for modeling.
-
Modeling: Select and apply the most suitable modeling techniques. Evaluate the model’s performance and refine as necessary.
-
Evaluation: Assess the model in light of business objectives. Review the entire process, identify potential issues, and validate model performance.
-
Deployment: Integrate the model into the production environment, while staying mindful of its ongoing performance.
Key CRISP-DM Concepts
-
Reusability: The iterative nature of CRISP-DM allows for the reusability of various outputs. For example, understanding gained from previous iterations can help refine subsequent models.
-
Traceability and Documentation: CRISP-DM emphasizes the need for documentation at each stage, enabling project members to trace decisions back to their sources.
-
Flexibility: The non-linear nature of CRISP-DM permits projects to jump between stages based on emerging insights or requirements.
Code Example: Cross-Validation for Model Evaluation
Here is the Python code:
import numpy as np from sklearn.model_selection import cross_val_score, KFold from sklearn.ensemble import RandomForestClassifier from sklearn.datasets import load_iris # Load sample dataset (Iris) for demonstration X, y = load_iris(return_X_y=True) # Create a classifier (Random Forest, for instance) clf = RandomForestClassifier(n_estimators=10) # 5-fold cross-validation cv = KFold(n_splits=5, shuffle=True, random_state=42) # Perform cross-validation cv_scores = cross_val_score(clf, X, y, cv=cv) # Print mean accuracy print(f"Mean accuracy: {np.mean(cv_scores):.2f}") -
- 7.
What are the types of data that can be mined?
Answer:In data mining, you can extract information from a broad spectrum of data types including texts, images, video, time series, sequences, spatial data, streaming data, and even documents.
Core Data Categories
Numerical Data
- Definition: Data expressed in numbers
- Mining Techniques: Statistical methods are used, and domain-specific methods leverage the inherent structure and characteristics of the data.
- Applications: Common in science and engineering tasks.
- Example: Measured quantities like temperature or weight.
Categorical Data
- Definition: Data that falls into distinct categories or classes with no specific order.
- Mining Techniques: Utilizes non-parametric methods, such as decision trees, and can require coding for one-hot encoding.
- Applications: Common in survey data or classification problems.
- Example: Types of fruits like apples and oranges.
Ordinal Data
- Definition: Categorical data with a clear order or ranking.
- Mining Techniques: Algorithms designed for ordinal data, like rank-order clustering or algorithms based on statistical tests.
- Applications: Common when surveys have ordered categories like “strongly agree” to “strongly disagree.”
- Example: Rankings such as movie ratings.
Text Data
- Definition: Data represented as a series of characters or words.
- Mining Techniques: Utilizes natural language processing (NLP) to understand and derive meaning from text.
- Applications: Ubiquitous in sentiment analysis, information retrieval, and text classification.
- Example: Comments on social media or entire articles.
Time Series Data
- Definition: Observations or measurements recorded at equally-spaced time intervals.
- Mining Techniques: Time-based methods, signal processing, and trend analysis to work with the time dimension of the data.
- Applications: Vital for tasks like financial forecasting, weather prediction, and many others.
- Example: Daily stock prices or hourly weather measurements.
Spatial Data
- Definition: Data that has a spatial component; it could be coordinates, addresses, or shaped regions.
- Mining Techniques: Uses geospatial algorithms and techniques such as k-nearest neighbors.
- Applications: Essential for tasks that involve geographic locations, like location-based recommendations and mapping.
- Example: GPS coordinates or states in a country.
Multi-View or Multi-Modal Data
- Definition: Data that embraces multiple fundamental modalities, such as images and texts.
- Mining Techniques: Advanced techniques labored from deep learning and algorithms tailored to each data type.
- Applications: Dominant in multimedia data processing, e.g., image captioning and video summarization.
- Example: Images with associated text tags.
- 8.
Explain the concept of data warehousing and its relevance to data mining.
Answer:Data Warehousing provides a centralized repository of integrated data from various sources for reporting, querying, and analytics. This integrated data is then utilized by Data Mining algorithms for pattern recognition, descriptive modeling, and predictive modeling.
Data Warehousing Key Concepts
-
OLTP vs. OLAP: OLTP (Online Transaction Processing) databases are optimized for fast data transaction, whereas OLAP (Online Analytical Processing) technologies are designed for complex ad-hoc queries and data analysis.
-
Data Mart: A specialized or department-focused subset of a data warehouse tailored to the needs of specific user groups.
-
Data Governance and Quality Management: Ensures consistency, accuracy, and reliability of data, crucial for meaningful analytics.
-
ETL Toolkit: The Extraction, Transformation, and Load (ETL) process enables data movement from source systems to the data warehouse, with transformations to ensure data quality.
-
Data Cube & Multidimensional Model: Datasets in a data warehouse are represented as MDX (Multidimensional Expressions) data cubes or through entities like fact tables and dimensions termed in a star or snowflake schema.
-
Metadata: Information about the data, such as its source, format, and any transformations, that aids in data interpretation and usage.
Relevance to Data Mining
-
Data Consistency and Reliability: Ensures that the data used for mining is pertinent and up-to-date, improving the accuracy of any insights or predictions.
-
Data Granularity: Data warehouses, through their design and the ETL process, provide a balanced, aggregated view of data suitable for higher-level analytics. This is especially useful for predictive models where too much granularity can lead to overfitting.
-
Data Comprehensiveness: A data warehouse consolidates data from multiple sources, offering a holistic view essential for more accurate model training. This also reduces the impact of data silos commonly found in organizations.
-
Historical Data Analysis: Data warehouses, with their ability to retain a history of data, enable mining algorithms to identify trends over time, essential for predictive modeling.
-
Performance Optimizations: Data warehouses, by virtue of OLAP design, provide faster querying and analytical capabilities, thus ensuring efficient data mining.
-
Data Preprocessing
- 9.
Why is data preprocessing an important step in data mining?
Answer:Data preprocessing is a critical step in the data mining pipeline. It cleans and prepares data, making it more suitable for modeling and ultimately leading to more accurate predictions and insights.
Key Objectives
- Data Quality: Identifying and rectifying issues like missing values, duplicates, and inconsistencies to ensure data integrity.
- Data Integration: Coalescing data from multiple sources in a unified format.
- Data Reduction: Reducing data volume but preserving significant information.
- Data Transformation: Making data compatible with machine learning algorithms through normalization, discretization, and other techniques.
- Data Discretization: Categorizing continuous values.
- Feature Selection/Engineering: Choosing relevant features for the model and creating new features to enhance its predictive capabilities.
Core Techniques
-
Normalization & Standardization: Adjusts feature scales to prevent dominance by features with larger magnitudes. Techniques such as
z-score,min-max scaling, orrobust scalingare employed. -
Imputation: Addresses missing data by filling in the gaps with estimated or average values.
-
One-Hot Encoding: Converts categorical data into numerical form to make it machine-readable.
-
Aggregation: Combines information, usually during data reduction.
-
Discarding Irrelevant Attributes: Removing data attributes that do not contribute to the modeling process.
-
Attribute Transformation: Radically alters and reshapes data attributes.
-
Filtering Outliers: An essential data cleansing step, as outliers can skew predictive modeling.
-
Balancing Classes: Adjusting class sizes to prevent model bias towards majority classes.
Data Splitting
Before data preprocessing, a dataset is typically divided into three sets. These are the training, validation, and test sets. Each set has a different role:
- Training Set: Used to train the model.
- Validation Set: Employed to optimize hyperparameters during model selection.
- Test Set: Ensures the model’s ability to generalize to unseen data.
It’s essential to precede each step of data preparation with the separation approach to avoid data leakage.
- 10.
What are the common data preprocessing techniques?
Answer:Data preprocessing is a crucial step in any machine learning task as it involves cleaning, transforming, and optimizing the dataset to ensure better model performance and more accurate predictions.
Common Techniques
-
Data Cleaning: Identifying and correcting errors in data.
-
Text Cleaning: Converting text data to a consistent format for further analysis.
-
Data Scaling: Normalizing or standardizing numerical variables for a clearer understanding.
-
Outlier Treatment: Handling extreme values that can skew model performance.
-
Missing Values Imputation: Filling in or handling missing data points.
-
Feature Selection: Identifying the most relevant features for model building.
-
Data Transformation: Converting data into a suitable format for model input.
-
One-Hot Encoding: Transforming categorical variables into a format compatible with ML algorithms.
-
Standardization: Rescaling numerical attributes with a mean of 0 and variance of 1.
-
Aggregated Data: Summarizing or consolidating data to a coarser level.
-
Data Reduction: Reducing the amount of data while maintaining its integrity.
-
- 11.
Explain the concept of data cleaning and why it is necessary.
Answer:Data cleaning is a critical step in any machine learning project, comprising techniques and tools that focus on ensuring datasets are free of errors, inconsistencies, and other issues.
Why Data Cleaning is Crucial
-
Garbage-In-Garbage-Out: ML models are only as good as the data they’re trained on. Dirty data can lead to unreliable models.
-
Resource Drain: Dealing with dirty data tends to be more time-consuming and expensive.
-
Ethical and Legal Implications: Biased or messy data can lead to biased or unfair outcomes, raising ethical and legal concerns.
-
Business Relevance: Models built on clean, reliable data are far more likely to produce actionable insights.
Common Data Quality Problems
Noisy Data
Noise refers to random errors, which can occur due to human or technical errors.
One possible solution is to use the majority voting method to eliminate the effect of random noise.
Missing Data
Missing values in a dataset can skew the results or even make certain observations unusable.
Strategies to Handle Missing Data:
- Delete: This is the simplest solution, but it can result in losing valuable information.
- Impute: Replace missing data with an estimated value.
Inconsistent Data
Inconsistencies can occur due to variations in data representation. For instance, date formats might differ, causing inconsistencies.
The most straightforward solution is to use data standardization techniques.
Duplicate Data
Duplicate entries can distort analytical results. Common in both structured and unstructured datasets, identifying and removing duplicates is a key step in data cleaning.
Techniques for Data Cleaning
-
Outlier Detection: Identifying and handling outliers can be key to improving the quality of models.
-
Normalization/Standardization: Data from different sources may contain values in varying scales. Standardizing ensures a level playing field.
-
Data Deduplication: Techniques like record linkage can be employed to find and eliminate duplicate entries.
-
Data Discretization: This involves converting continuous data into distinct categories or bins.
-
- 12.
How does data transformation differ from data normalization?
Answer:Data normalization and transformation are key pre-processing steps in preparing data for machine learning. While they both aim to optimize model performance by improving data quality, they focus on different aspects.
Data Transformation
-
Objective: To make data suitable for modeling by addressing issues like skewness, heteroscedasticity, and non-linearity.
-
Methods: Common transformations include taking logarithms, exponentiation, and power transformations.
-
Implementation: Transformation is often indicated in the analysis of the data. For instance, if the data exhibits a non-linear relationship, a square or cube transformation may be applied.
Code Example: Data Transformation
Here is the Python code:
import numpy as np
import pandas as pd

# Create sample data
data = {'x': np.arange(1, 11), 'y': np.array([1, 4, 9, 16, 25, 36, 49, 64, 81, 100])}
df = pd.DataFrame(data)

# Apply square root transformation
df['new_x'] = np.sqrt(df['x'])

print(df)
Output:
    x   y     new_x
0   1   1  1.000000
1   2   4  1.414214
2   3   9  1.732051
3   4  16  2.000000
4   5  25  2.236068
5   6  36  2.449490
6   7  49  2.645751
7   8  64  2.828427
8   9  81  3.000000
9  10 100  3.162278
Data Normalization
-
Objective: To standardize numerical features, making different features comparable and improving convergence speed in certain algorithms.
-
Methods: Common techniques include min-max scaling to put values within a range, and z-score to standardize to a mean of 0 and a standard deviation of 1.
-
Implementation: It’s usually applied to numerical features, although some algorithms and models require normalization of categorical variables as well.
Code Example: Data Normalization
Here is the Python code:
from sklearn.preprocessing import MinMaxScaler

# Create data
data = {'age': [25, 38, 50, 45, 20, 37], 'income': [50000, 80000, 100000, 90000, 30000, 75000]}
df = pd.DataFrame(data)

# Initialize the Scaler
scaler = MinMaxScaler()

# Fit and transform the data
df[['age', 'income']] = scaler.fit_transform(df[['age', 'income']])

print(df)
Output:
age income 0 0.031250 0.142857 1 0.375000 0.500000 2 0.687500 0.857143 3 0.562500 0.642857 4 0.000000 0.000000 5 0.354167 0.428571 -
- 13.
What are the techniques for data reduction in the context of data mining?
Answer:Data reduction intends to streamline datasets, making them easier to handle and more nuanced in their insights.
Techniques for Data Reduction
Dimensionality Reduction
-
Techniques like Principal Component Analysis (PCA) minimize information loss by consolidating correlated columns.
-
Function: , where has the top eigenvectors of the covariance matrix.
Numerosity Reduction
-
Binning or Histogramming: Data grouped into bins to represent a range of values with a single value, thus reducing dataset size.
-
Clustering: Variants like k-means can summarize similar data points while retaining key characteristics.
Distortion-Based Reduction
-
Regression: Uses the relationship between variables to find a reduced representation, e.g., linear regression predicting the target variable using independent ones.
-
Discretization: Converts continuous variables into a set of intervals. This simplification minimizes precision while maintaining the general trends in the data.
Density-Based Methods
- Cluster Pruning: Eliminates data points in small clusters believed to be noise, thus reducing dataset size without significant information loss.
Transformations
-
Aggregation: Combines multiple records into a single summary metric, leading to a more compact dataset.
-
Normalization and Standardization: Scales values to a smaller range, ensuring all variables contribute more equally in certain analyses.
Feature Selection
-
Filter Methods: Using statistical tests like ANOVA, the aim is to select features based on their relationship to the target variable.
-
Wrapper Methods: Algorithms select the best features for a particular predictive model based on their contribution; examples include recursive feature elimination (RFE).
-
Embedded Methods: These selection techniques are integrated within the chosen predictive model, e.g., LASSO regularization.
Data Cube Aggregation
- Minimizes data points in multi-dimensional datasets through aggregation along various axes.
Code Example: Principal Component Analysis
Here is the Python code:
from sklearn.decomposition import PCA import numpy as np # Generate sample data data = np.random.randn(100, 4) # Initialize PCA pca = PCA(n_components=2) # Fit and transform the data reduced_data = pca.fit_transform(data) -
- 14.
How do you handle missing values in a dataset?
Answer:Missing data, though common in real-world datasets, can pose significant challenges for machine learning algorithms. Here are some strategies to handle them.
Techniques for Managing Missing Data
Listwise Deletion
Listwise deletion, a straightforward method, involves removing entire rows that contain missing values. While this approach is simple, it can lead to loss of valuable data, especially if missingness is spread across multiple columns within the same row. This can result in reduced model accuracy and statistical power.
Pairwise Deletion
Pairwise deletion, instead of removing the entire observation, removes individual pairwise (column-wise) missing values from the analysis. This allows for the utilization of available data and therefore, can be more efficient than Listwise Deletion.
Imputation
Imputation techniques replace the missing values with estimates, making the dataset more complete. Common imputation strategies include:
-
Mean/Median Imputation: Replace missing values in a feature with the mean or median of non-missing values in that feature.
-
Mode Imputation: Applicable for categorical data, mode imputation replaces missing values with the most frequent category.
-
Regression Imputation: This approach infers the missing values in a column based on other columns. For example, in a regression model, one column with missing values can be treated as the dependent variable while the rest of the columns are treated as independent variables.
-
K-Nearest Neighbors (K-NN) Imputation: Missing values are estimated by using the corresponding values in other data points, where closeness is defined by distance measures like Euclidean or Manhattan distance.
-
Multiple Imputation: Multiple imputation generates several imputations for each missing value. The analysis is then performed on each dataset, combining the results accurately.
Code Example: Imputation Using Scikit-Learn
Here is the Python code:
from sklearn.impute import SimpleImputer
import pandas as pd

# Load dataset with missing values
# For simplicity, let's assume 'dataset' is already loaded

# Initialize the SimpleImputer
imputer = SimpleImputer(strategy='mean')

# The fit_transform method imputes missing values and transforms the dataset
imputed_data = pd.DataFrame(imputer.fit_transform(dataset), columns=dataset.columns)
In the code above,
SimpleImputeris used with themeanstrategy to replace missing values with the mean of non-missing values in each column. Other strategies such asmedianormost_frequentare also available. -
- 15.
What are the methods for outlier detection during data preprocessing?
Answer:Outlier detection is a crucial step in data preprocessing, essential for ensuring the quality and accuracy of your machine learning models. Here are some commonly used techniques:
Univariate and Multivariate Methods
Box-and-Whisker Plots
Visualize the spread of data across various quantiles of a distribution, particularly identifying any datapoints that lie beyond from the quartiles.
Z-Score
Compute the number of standard deviations a data point deviates from the mean. Points beyond a certain threshold are often flagged as outliers, frequently set at standard deviations.
Modified Z-Score
Similar to Z-Score, but using the median rather than the mean and a threshold, such as , to flag outliers.
Mahalanobis Distance
Consider both the mean and the covariance of the data, calculating the distance of each point from the centroid. This technique is especially useful when the features are correlated, enhancing multivariate outlier detection.
Proximity-Based Methods
K-Nearest Neighbors (K-NN)
Flags data points with fewest neighbors within a certain distance, as defined by the number of neighbors .
Local Outlier Factor (LOF)
Calculates the local density of points by comparing the density around a point to the densities of its neighbors. Points with a substantially lower density might be outliers.
Clustering Techniques
DBSCAN (Density-Based Spatial Clustering of Applications with Noise)
Identifies core samples of high-density data and extends clusters from them. Points not in any cluster are marked as ‘noise,’ which are essentially the outliers.
Isolation Forest
Constructs a forest of random trees and isolates the outliers. The number of partitions required to single out an instance serves as a measure of its abnormality.
Mean Shift
Finds areas of “high density” within a feature space defined as the area containing a relatively large number of data points’ aiming to find and move points towards the modes of the distribution.
One-Class SVM
A type of support vector machine that is trained using only the inliers. It then uses a decision boundary to identify outliers in the test data.
Gaussian Mixture Models (GMMs)
Models the density of the data using a mixture of multiple Gaussian distributions. By analyzing which Gaussian distribution a data point is more likely to have originated from, the method can detect unusual observations.
Visualization Methods
Principal Component Analysis (PCA)
Projects the high-dimensional data onto a lower-dimensional space, making it possible to identify outliers visually.
T-Distributed Stochastic Neighbor Embedding (t-SNE)
Also known as t-SNE, this technique reduces the dimensionality of the data while maintaining a focus on preserving local structures. It’s mainly used for visualization but can help spot outliers.
Statistical and Historical Approaches
Time-based Outlier Detection
Especially useful for temporal data, where unusual values occur at specific times. Deviations from the expected values or trends at these times mark the data points as outliers.
Grubbs’ Test
Commonly used in quality control procedures, it’s a parametric test to identify an outlier in a univariate dataset.